Lab 9 - Cisco Platforms and APIs🔗
9.1 Set up GitHub Repository🔗
Objectives🔗
Part 1: Join the GitHub Classroom
Part 2: Initialize the Local Repository
Part 3: Set up the Remote Repository
Instructions🔗
Part 1: Join the GitHub Classroom🔗
-
Follow the GitHub assignment link posted in Canvas. If you did not complete the setup in Lab 2.2 you will need to authorize GitHub Classroom to link with your account and select your name from the list of students.
-
Accept the assignment and refresh the page until it says your repository has been created. Click the link to proceed to the repository.
Important
GitHub Classroom is currently experiencing a bug where you might receive a Repository Access Issue error after accepting the assignment. If this happens, check the e-mail connected to your GitHub account for an invitation e-mail from GitHub. Use the View Invitation link in the e-mail to see the link to accept the invitation and proceed to the repository.
-
Select the Code dropdown and copy the HTTPS URL. Store it somewhere for use in a later step.
Tip
If you've configured your VM to use SSH to connect to GitHub instead of HTTPS, click on the Code dropdown, select the SSH tab, and copy the URL from there instead.
Part 2: Initialize the Local Repository🔗
You will be creating a local repository from a folder on the DEVASC VM. This folder already contains some files, so you will need to initialize a repository in the folder, pull down the files from the remote GitHub Classroom repository, then add the local files to the local repository to combine the remote and local files into a single repository.
-
Inside the DEVASC VM, open a terminal and change to the
~/labs/devnet-src/webex-teamsdirectory.devasc@labvm:~$ cd labs/devnet-src/webex-teams/ devasc@labvm:~/labs/devnet-src/webex-teams$ -
View the listing of all files currently in the sample-app directory.
devasc@labvm:~/labs/devnet-src/webex-teams$ ls -la total 48 drwxr-xr-x 2 devasc devasc 4096 Jun 1 2020 . drwxr-xr-x 19 devasc devasc 4096 Mar 24 21:20 .. -rw-r--r-- 1 devasc devasc 79 Apr 23 2020 authentication.py -rw-r--r-- 1 devasc devasc 73 Apr 23 2020 create-markdown-message.py -rw-r--r-- 1 devasc devasc 92 Apr 23 2020 create-membership.py -rw-r--r-- 1 devasc devasc 85 Apr 23 2020 create-rooms.py -rw-r--r-- 1 devasc devasc 84 Apr 23 2020 get-room-details.py -rw-r--r-- 1 devasc devasc 75 Apr 23 2020 list-memberships.py -rw-r--r-- 1 devasc devasc 79 Apr 23 2020 list-people.py -rw-r--r-- 1 devasc devasc 85 Apr 23 2020 list-rooms.py -rw-r--r-- 1 devasc devasc 93 Apr 23 2020 pagination-next.py -rw-r--r-- 1 devasc devasc 75 Apr 23 2020 pagination.py devasc@labvm:~/labs/devnet-src/webex-teams$ -
Initialize this directory as a Git repository (don't miss the
.at the end of the command).devasc@labvm:~/labs/devnet-src/webex-teams$ git init . Initialized empty Git repository in /home/devasc/labs/devnet-src/webex-teams/.git/ devasc@labvm:~/labs/devnet-src/webex-teams$
Part 3: Set up the Remote Repository🔗
-
Since we initialized our own local repository, rather than cloning an existing remote repository, we need to tell Git the location of the remote repository to synchronize with. Configure the location of the remote repository using the
git remote addcommand. Use the URL to the GitHub Classroom repository you copied at the end of Part 1, not the one in the command below.Tip
If you've configured your VM to use SSH to connect to GitHub, use the SSH URL that you copied in step 1, rather than the HTTPS link.
devasc@labvm:~/labs/devnet-src/webex-teams$ git remote add origin https://github.com/Ontario-Tech-NITS/lab-9-cisco-platforms-and-apis-<username>.git
devasc@labvm:~/labs/devnet-src/webex-teams$
Important
Make sure you use your GitHub URL that you copied in Part 1, not the one in the command example! Also, if you're using SSH, your URL will start with
git@github.comrather thanhttps://. -
Verify that the remote is properly configured with the
git remote --verbosecommand.devasc@labvm:~/labs/devnet-src/webex-teams$ git remote --verbose origin https://github.com/Ontario-Tech-NITS/lab-9-cisco-platforms-and-apis-<username>.git (fetch) origin https://github.com/Ontario-Tech-NITS/lab-9-cisco-platforms-and-apis-<username>.git (push) devasc@labvm:~/labs/devnet-src/webex-teams$ -
Pull down the files from the remote repository into the local repository. Remember to use your Personal Access Token as the password.
Tip
If you've configured your VM to use SSH to connect to GitHub instead of HTTPS, you will not be asked for a username and password, although you may be asked for a passphrase for your SSH key, if you configured one.
devasc@labvm:~/labs/devnet-src/webex-teams$ git pull origin main Username for 'https://github.com': username Password for 'https://username@github.com': Personal Access Token remote: Enumerating objects: 16, done. remote: Counting objects: 100% (16/16), done. remote: Compressing objects: 100% (13/13), done. remote: Total 16 (delta 3), reused 4 (delta 0), pack-reused 0 (from 0) Unpacking objects: 100% (16/16), 1.09 MiB | 5.29 MiB/s, done. From github.com:Ontario-Tech-NITS/lab-9-cisco-platforms-and-apis-<username> * branch main -> FETCH_HEAD * [new branch] main -> origin/main devasc@labvm:~/labs/devnet-src/webex-teams$ -
Use
git statusto verify all the local files are currently untracked.devasc@labvm:~/labs/devnet-src/webex-teams$ git status On branch main Untracked files: (use "git add <file>..." to include in what will be committed) authentication.py create-markdown-message.py create-membership.py create-rooms.py get-room-details.py list-memberships.py list-people.py list-rooms.py pagination-next.py pagination.py nothing added to commit but untracked files present (use "git add" to track) devasc@labvm:~/labs/devnet-src/webex-teams$ -
Add the files from the local working folder to the staging area (don't miss the . at the end of the command).
devasc@labvm:~/labs/devnet-src/webex-teams$ git add . devasc@labvm:~/labs/devnet-src/webex-teams$ -
Commit these new files to the local repository. Use the commit message Initializing the repository.
devasc@labvm:~/labs/devnet-src/webex-teams$ git commit -m "Initializing the repository" [main b80f6e7] Initializing the repository 10 files changed, 10 insertions(+) create mode 100644 authentication.py create mode 100644 create-markdown-message.py create mode 100644 create-membership.py create mode 100644 create-rooms.py create mode 100644 get-room-details.py create mode 100644 list-memberships.py create mode 100644 list-people.py create mode 100644 list-rooms.py create mode 100644 pagination-next.py create mode 100644 pagination.py devasc@labvm:~/labs/devnet-src/webex-teams$ -
Use
git statusagain to verify that all files have been committed to the local repository and that you are working on a clean tree.devasc@labvm:~/labs/devnet-src/webex-teams$ git status On branch main nothing to commit, working tree clean devasc@labvm:~/labs/devnet-src/webex-teams$ -
Push the local repository to the remote repository on GitHub, adding the files from the DEVASC VM to the existing repository. Remember to use your Personal Access Token when prompted for your password.
Tip
If you've configured your VM to use SSH to connect to GitHub instead of HTTPS, you will not be asked for a username and password, although you may be asked for a passphrase for your SSH key, if you configured one.
devasc@labvm:~/labs/devnet-src/webex-teams$ git push origin main Username for 'https://github.com': <username> Password for 'https://username@github.com': Personal Access Token Enumerating objects: 13, done. Counting objects: 100% (13/13), done. Delta compression using up to 2 threads Compressing objects: 100% (12/12), done. Writing objects: 100% (12/12), 1.55 KiB | 316.00 KiB/s, done. Total 12 (delta 0), reused 0 (delta 0), pack-reused 0 (from 0) To github.com:Ontario-Tech-NITS/lab-9-cisco-platforms-and-apis-<username>.git ad44607..b80f6e7 main -> main devasc@labvm:~/labs/devnet-src/webex-teams$ -
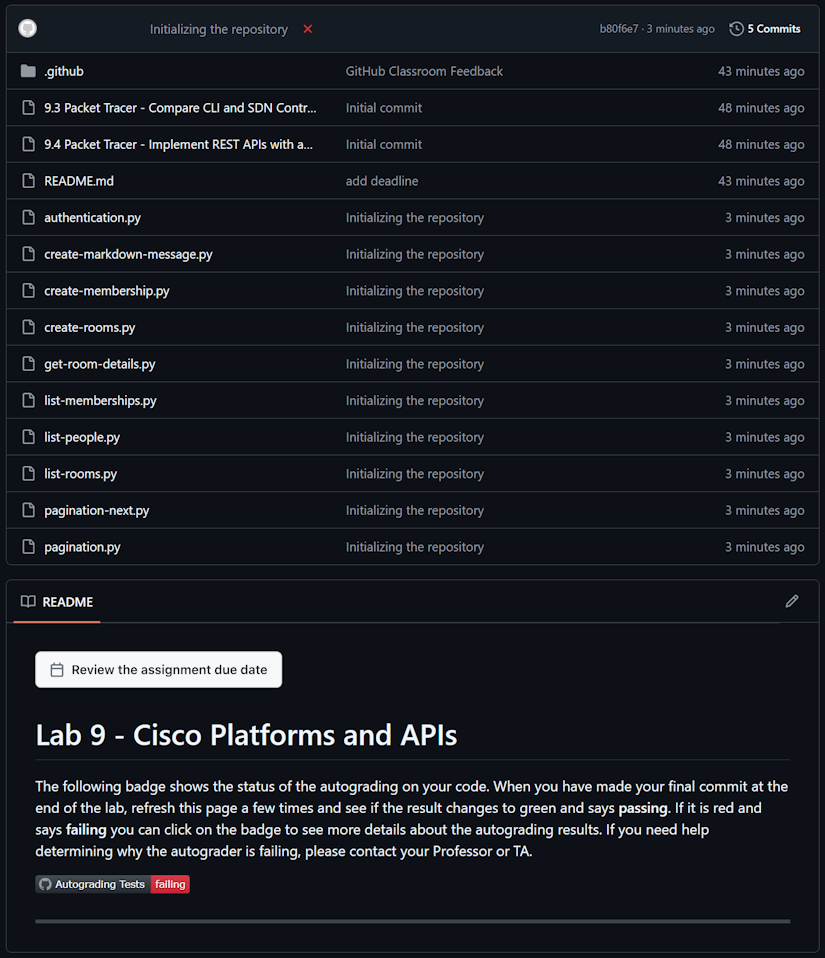
Using a web browser, open the remote repository on GitHub and verify that you see the newly tracked files. Your local and remote repositories are now synchronized, and you are ready to complete the rest of the lab, committing your changes as you go (when instructed).
Note
The Autograding Tests will say "failing" at this point because you haven't finished the lab. This is normal.
9.2 Construct a Python Script to Manage Webex Teams🔗
Objectives🔗
Part 1: Get Your Webex Teams Access Token
Part 2: Test Your Access Token
Part 3: Manage Rooms in Webex Teams
Part 4: Manage Memberships in Webex Teams
Part 5: Manage Messages in Webex Teams
Background🔗
In this lab, you will use Webex Teams APIs to authenticate, manage people, manage rooms, manage memberships to rooms, and send a message.
Instructions🔗
Part 1: Get Your Webex Teams Access Token🔗
In this Part, you sign up for or log in to your Webex account, explore the API documentation, get your access token, and then test your access token that you will use in your API calls.
Step 1: Login to Webex🔗
-
Open the Chromium web browser in the DEVASC VM.
-
Go to the Webex developer website: https://developer.webex.com/
-
Log in with the account you created in Lab 1.
Step 2: Get your access token🔗
-
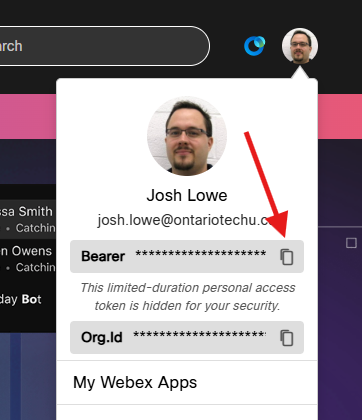
Click your profile photo in the top-right corner of the screen, then click the copy icon next to your Bearer token
Tip
A Personal Access Token provides access to your account to anyone who knows it. Make sure to keep it secret.
Note
You will get a message stating that the token is valid for a set amount of time, which was 12 hours at the time this lab was written. You will need to get a new token and update your Python scripts if you return to this lab after your token expires. Logging out of the WebEx Developer portal also appears to invalidate your token.
-
Paste your personal access token into a text file for use later in this lab.
Part 2: Test Your Access Token🔗
You can test your access token within the OpenAPI documentation on the developer site. However, you will use your token in Python scripts. Therefore, you should test that it works in a script, as well.
Step 1: Test your access token on the developer site🔗
You can test your access token inside the WebEx OpenAPI documentation at https://developer.webex.com.
-
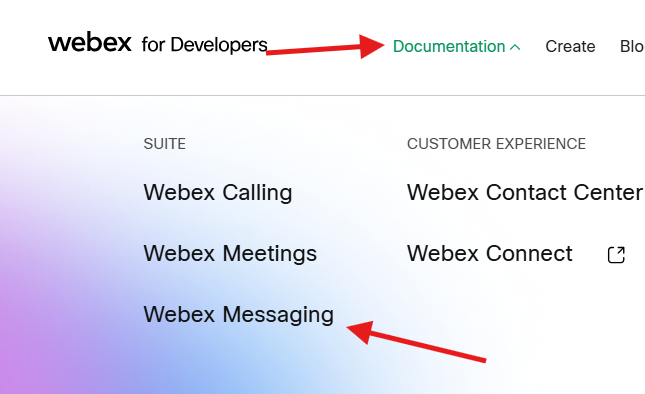
Return to your browser and at the top of the screen, click Documentation > Webex Messaging.
-
In the menu on the left, expand All APIs.
-
Under All APIs, expand People, and then click the link for Get My Own Details.
-
In the Try it panel on the far right, notice that your token is already populated in the Headers section under Authorization (the hidden value after the word Bearer).
-
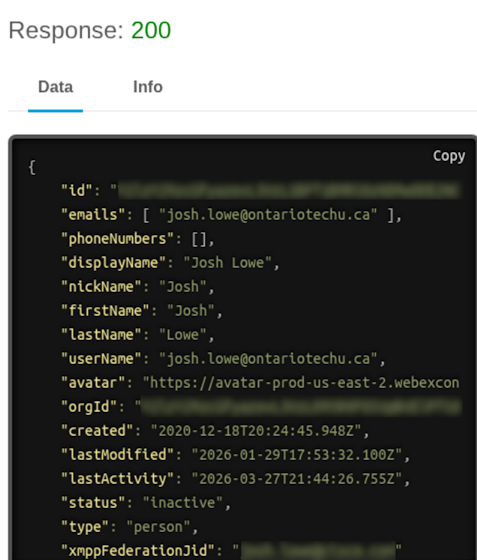
Click Run to test your access. You should see Response: 200, with your personal information shown in the Data section.
-
In the middle section of the browser window, you can review all the documentation for the Response properties.
Step 2: Use a Python script to test your access token🔗
-
Leave the Chromium browser open and launch VS Code . Then click File > Open Folder... and navigate to the
~/labs/devnet-src/webex-teamsdirectory. Click Open. -
In the EXPLORER panel, you should now see all the placeholder
.pyfiles you will use in this lab. Click theauthentciation.pyfile. -
Place the following code into the file, which calls the Get My Own Details API as you used in the web browser. Be sure to replace
your_token_herewith your WebEx personal access token you copied in the previous step.Pythonimport requests import json access_token = 'your_token_here' url = 'https://webexapis.com/v1/people/me' headers = { 'Authorization': 'Bearer {}'.format(access_token) } res = requests.get(url, headers=headers) print(json.dumps(res.json(), indent=4)) -
Save and run the file. You should get the same output you saw in the OpenAPI documentation.
Note
The values for some of the keys have been truncated in the output below.
devasc@labvm:~/labs/devnet-src/webex-teams$ python3 authentication.py
{
    "id": "Y2lz...UyM2U",
    "emails": [
        "your-email@example.com"
    ],
    "phoneNumbers": [],
    "displayName": "Your-First-Name Your-Last-Name",
    "nickName": "Your-Nick-Name",
    "firstName": " Your-First-Name",
    "lastName": "Your-Last-Name",
    "username": "Your-Email-Address",
    "orgId": "Y2lzY2...UxMGY",
    "created": "2012-06-15T20:23:12.529Z",
    "lastModified": "2026-03-25T20:16:52.111Z",
    "status": "active",
    "type": "person"
}
devasc@labvm:~/labs/devnet-src/webex-teams$
Part 3: Manage Rooms in Webex Teams🔗
Rooms, also called spaces in the user interface, let people send messages and files to collaborate virtually in collective meeting places. In this Part, you will list rooms, create a room, and get a room's details.
Step 1: Locate and investigate the API documentation for rooms🔗
-
Back in the WebEx Messaging API website, under All APIs expand Rooms.
-
Click the GET request for List Rooms and explore the Query Parameters.
Step 2: Use a Python script to list all the rooms for an authenticated user🔗
-
For this step, you will need to be a member of at least one room. A conversation with one other person is considered a room in Webex.
-
In VS Code , click the
list-rooms.pyfile. -
Place the following code into the file. Be sure to replace
your_token_herewith your personal access token.Pythonimport requests import json access_token = 'your_token_here' url = 'https://webexapis.com/v1/rooms' headers = { 'Authorization': 'Bearer {}'.format(access_token), 'Content-Type': 'application/json' } params={'max': '100'} res = requests.get(url, headers=headers, params=params) print(json.dumps(res.json(), indent=4)) -
Save and run the file. This output shows all the rooms associated with your account. Only one room is listed here, but you may have more in your output. ID values have been truncated.
devasc@labvm:~/labs/devnet-src/webex-teams$ python3 list-rooms.py
{
    "items": [
        {
            "id": "Y2lzY29zcGF...U5YTU3",
            "title": "INFR 3200U - Intro to DevOps and Automation - W2026",
            "type": "group",
            "isLocked": false,
            "lastActivity": "2026-02-12T05:09:22.889Z",
            "creatorId": "Y2lzY29zcGF...jQ1NWI",
            "created": "2026-01-16T17:06:53.489Z",
            "ownerId": "Y2lzY29zcGF...2I0NTc",
            "isPublic": false,
            "isReadOnly": false
        },
# additional rooms displayed up to 'max' value.
    ]
}
devasc@labvm:~/labs/devnet-src/webex-teams$
Step 3: Locate and investigate the API documentation for posting to the Rooms API🔗
-
Back in the WebEx Messaging API website, under All APIs expand Rooms if necessary.
-
The Rooms API has one POST method for Create a Room. Click the link to see the Request Parameters that are available. In your script, you will use the required
titleparameter (marked with a red asterisk).
Step 4: Use a Python script to create a room🔗
-
In VS Code , click the
create-rooms.pyfile. -
Place the following code into the file. Be sure to replace
your_token_herewith your personal access token. Notice that this is a POST request and uses thetitleparameter.Important
Change the title of the room to use your first name, not the word "Name". The outputs show "Name's DevNet Associate Training!" only as an example.
Pythonimport requests import json access_token = "your_token_here" url = "https://webexapis.com/v1/rooms" headers = { "Authorization": "Bearer {}".format(access_token), "Content-Type": "application/json", } params = {"title": "Name's DevNet Associate Training!"} res = requests.post(url, headers=headers, json=params) print(json.dumps(res.json(), indent=4)) -
Save and run the file. You should get a response similar to the following, which shows a summary about the newly created room. ID values have been truncated. The room
idandtitleare highlighted. Copy the room ID and save it in a text file for use in the rest of this lab.devasc@labvm:~/labs/devnet-src/webex-teams$ python3 create-rooms.py { "id": "Y2l…TYz", "title": "Name's DevNet Associate Training!", "type": "group", "isLocked": false, "lastActivity": "2026-03-28T14:26:19.767Z", "creatorId": "Y2l…YmY", "created": "2026-03-28T14:26:19.767Z", "ownerId": "Y2l…MGI", "isPublic": false } devasc@labvm:~/labs/devnet-src/webex-teams$ -
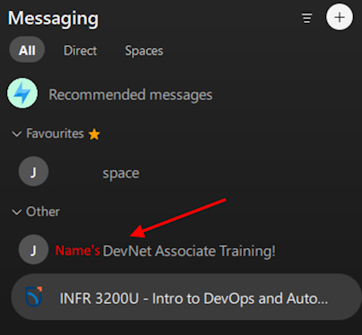
In your Webex application, verify you now see the <Name>'s DevNet Associate Training! room. You are currently the only member.
Note
The room should have your first name, not the word "name".
Important
Do not delete this room! It will be used for grading your lab.
Step 5: Use a Python script to get room details🔗
If you need to retrieve details about a room after it's been created, you can use the Get Room Details API to retrieve that information.
-
In VS Code , click the
get-room-details.pyfile. -
Place the following code into the file. Replace
your_token_herewith your personal access token. Replaceyour_room_idwith the value you got in the previous step.Pythonimport requests import json access_token = "your_token_here" room_id = "your_room_id" url = "https://webexapis.com/v1/rooms/{}".format(room_id) headers = { "Authorization": "Bearer {}".format(access_token), "Content-Type": "application/json", } res = requests.get(url, headers=headers) print(json.dumps(res.json(), indent=4)) -
Save and run the file. You should get a response similar to the following, which shows the details about the room.
Important
Remember, it should say your name, not the word "Name"
devasc@labvm:~/labs/devnet-src/webex-teams$ python3 get-room-details.py
{
    "id": "Y2l…TBm",
    "title": "Name's DevNet Associate Training!",
    "type": "group",
    "isLocked": false,
    "lastActivity": "2026-03-28T14:32:55.422Z",
    "creatorId": "Y2l…YmY",
    "created": "2026-03-28T14:32:55.422Z",
    "ownerId": "Y2l…MGI",
    "isPublic": false,
    "isReadOnly": false
}
devasc@labvm:~/labs/devnet-src/webex-teams$
Part 4: Manage Memberships in Webex Teams🔗
In this Part, you will use the Membership API to add someone to your room.
Step 1: Locate and investigate the API documentation for memberships🔗
-
Back in the WebEx Messaging API website, under All APIs expand Memberships.
Important
Ensure you expand Memberships and not Team Memberships
-
Click the GET request for List Memberships and explore the Request Parameters.
Step 2: Use a Python script to list the members of the room🔗
-
In VS Code , click the
list-memberships.pyfile. -
Place the following code into the file. Replace
your_token_herewith your personal access token. Replaceyour_room_idwith the value you got in the previous part.Pythonimport requests import json access_token = "your_token_here" room_id = "your_room_id" url = "https://webexapis.com/v1/memberships" headers = { "Authorization": "Bearer {}".format(access_token), "Content-Type": "application/json", } params = {"roomId": room_id} res = requests.get(url, headers=headers, params=params) print(json.dumps(res.json(), indent=4)) -
Save and run the file. You should get a response similar to the following, which lists all of the members currently added to the room. You should be the only member. ID values have been truncated.
devasc@labvm:~/labs/devnet-src/webex-teams$ python3 list-memberships.py
{
    "items": [
        {
            "id": "Y2l…wZg",
            "roomId": "Y2l…TBm",
            "roomType": "group",
            "personId": "Y2l…YmY",
            "personEmail": "yourname@ontariotechu.net",
            "personDisplayName": "Your Name",
            "personOrgId": "Y2l…MGI",
            "isModerator": false,
            "isMonitor": false,
            "created": " 2026-03-28T14:32:55.502Z"
        }
    ]
}
devasc@labvm:~/labs/devnet-src/webex-teams$
Step 3: Locate and investigate the API documentation for posting to the Memberships API🔗
-
Back in the WebEx Messaging API website, under All APIs expand Memberships, if necessary.
-
The Memberships API has one POST method for Create a Membership. Click the link to see the Request Parameters that are available. In your script, you will use the
personEmailand the requiredroomIDparameters.
Step 4: Use a Python script to create a membership, adding someone to the room🔗
For this step, you will add the professor to your newly created room.
-
In VS Code , click the
create-membership.pyfile. -
Place the following code into the file. Replace
your_token_herewith your personal access token. Replaceyour_room_idwith the value you got in step 2.Important
Leave the e-mail address as it is so you add the professor to your room (
josh.lowe@ontariotechu.ca). If you don't add the professor to the room you will lose marks!Pythonimport requests import json access_token = "your_token_here" room_id = "your_room_id" person_email = "josh.lowe@ontariotechu.ca" url = "https://webexapis.com/v1/memberships" headers = { "Authorization": "Bearer {}".format(access_token), "Content-Type": "application/json", } params = {"roomId": room_id, "personEmail": person_email} res = requests.post(url, headers=headers, json=params) print(json.dumps(res.json(), indent=4)) -
Save and run the file. You should get a response similar to the following, which lists the details of the new user added to the room. ID values have been truncated.
devasc@labvm:~/labs/devnet-src/webex-teams$ python3 create-membership.py { "id": "Y2l…wZg", "roomId": "Y2l…TBm", "roomType": "group", "personId": "Y2l…NWI", "personEmail": "josh.lowe@ontariotechu.ca", "personDisplayName": "Josh Lowe", "personOrgId": "Y2l…NTc", "isModerator": false, "isMonitor": false, "isRoomHidden": false, "created": " 2026-03-28T14:55:12.100Z" } devasc@labvm:~/labs/devnet-src/webex-teams$ -
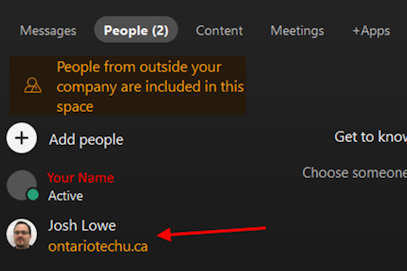
In your Webex Teams application, click on the <Name>'s DevNet Associate Training! space, then click People and confirm you now see Josh Lowe listed, in addition to your own account.
Important
Do not delete this room or remove the Josh Lowe account from it. Part of your grade for this lab will come from verification that this account is in this room.
Part 5: Manage Messages in Webex Teams🔗
In Webex Teams, a message can contain plain text, Markdown, or a file attachment. Each message is displayed on its own line along with a timestamp and sender information. You can use this Messages API to list, create, and delete messages. In this Part, you will send a message to the room you created in this lab.
Step 1: Locate and investigate the API documentation for messages🔗
-
Back in the WebEx Messaging API website, under All APIs expand Messages.
-
Click the POST request for Create a Message and explore the Request Parameters. Notice for a simple text message, you can use the
textormarkdownparameter. In this step, you will specify a message with Markdown formatting.Note
You can find a Markdown Cheat Sheet in the "Other" module on Canvas.
Step 2: Use a Python script to send a message to a Webex room🔗
-
In VS Code , click the
create-markdown-message.pyfile. -
Place the following code into the file. Replace
your_token_herewith your personal access token. Replaceyour_room_idwith the value you got in the previous part. The double asterisks (**) around DevNet Associates is markdown that will make the text bold.Pythonimport requests import json access_token = 'your_token_here' room_id = 'your_room_id' message = 'Hello **DevNet Associates**!!' url = 'https://webexapis.com/v1/messages' headers = { 'Authorization': 'Bearer {}'.format(access_token), 'Content-Type': 'application/json' } params = {'roomId': room_id, 'markdown': message} res = requests.post(url, headers=headers, json=params) print(json.dumps(res.json(), indent=4)) -
Save and run the file. You should get a response similar to the following. Notice that the Markdown was converted to HTML. ID values have been truncated.
devasc@labvm:~/labs/devnet-src/webex-teams$ python3 create-markdown-message.py { "id": "Y2l…WZh", "roomId": "Y2l…TBm", "roomType": "group", "text": "Hello DevNet Associates!!", "personId": "Y2l…YmY", "personEmail": "joshua.lowe@ontariotechu.net", "markdown": "Hello **DevNet Associates**!!", "html": "<p>Hello <strong>DevNet Associates</strong>!!</p>", "created": " 2026-03-28T15:27:54.619Z" } devasc@labvm:~/labs/devnet-src/webex-teams$ -
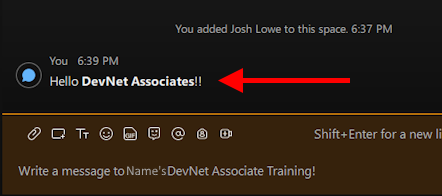
In your Webex application, you should now see the Hello DevNet Associates!! message in your <Name>'s DevNet Associate Training! room.
Step 3: Commit the changes to the repository🔗
-
Use
git statusto see which files have been added and modified since the last commit.devasc@labvm:~/labs/devnet-src/webex-teams$ git status On branch main Changes not staged for commit: (use "git add <file>..." to update what will be committed) (use "git restore <file>..." to discard changes in working directory) modified: authentication.py modified: create-markdown-message.py modified: create-membership.py modified: create-rooms.py modified: get-room-details.py modified: list-memberships.py modified: list-rooms.py no changes added to commit (use "git add" and/or "git commit -a") devasc@labvm:~/labs/devnet-src/webex-teams$ -
Add all the files and folders to the staging area with
git add .(don't miss the "." at the end). Verify all files have now been staged withgit status.devasc@labvm:~/labs/devnet-src/webex-teams$ git add . devasc@labvm:~/labs/devnet-src/webex-teams$ git status On branch main Changes to be committed: (use "git restore --staged <file>..." to unstage) modified: authentication.py modified: create-markdown-message.py modified: create-membership.py modified: create-rooms.py modified: get-room-details.py modified: list-memberships.py modified: list-rooms.py devasc@labvm:~/labs/devnet-src/webex-teams$ -
Commit the changes to the local repository using the message WebEx API Lab Complete!.
devasc@labvm:~/labs/devnet-src/webex-teams$ git commit -m "WebEx API Lab Complete!"
[main 0be165b] WebEx API Lab Complete!
 7 files changed, 87 insertions(+), 7 deletions(-)
devasc@labvm:~/labs/devnet-src/webex-teams$
9.3 Compare CLI and SDN Controller Network Management (Packet Tracer Lab)🔗
Objectives🔗
Part 1: Set up Packet Tracer
Part 2: Explore the Network Topology
Part 3: Use the CLI to Gather Information
Part 4: Configure an SDN Controller
Part 5: Use an SDN Controller to Discover a Topology
Part 6: Use an SDN Controller to Gather Information
Part 7: Use an SDN Controller to Configure Network Settings
Background🔗
In this Packet Tracer activity, you will compare the differences between managing a network from the command line interface (CLI) and using a software-defined networking (SDN) controller to manage the network.
Instructions🔗
Part 1: Set up Packet Tracer🔗
In this Part, you will open Packet Tracer and log in. You will also copy over the Packet Tracer activity files used in this lab.
Important
Make sure you use Packet Tracer from within the DEVASC VM, not on your local machine!
Step 1: Install an Updated Version of Packet Tracer🔗
-
Open the Chromium Web Browser in the DEVASC VM.
-
Navigate to Canvas and log in.
-
Select the INFR 3200U course, then click Modules.
-
Under the Labs module, click the link to download Packet Tracer 8.2.2 for Ubuntu.
-
Wait for the file to be downloaded completely. This may take a few minutes.
-
Once the download is complete, close the Chromium Web Browser.
-
Open the Terminal.
-
Enter the following command to install Packet Tracer and provide the password
Cisco123!if prompted:devasc@labvm:~$ sudo apt-get install ~/Downloads/PacketTracer822_amd64_signed.deb -y -
The Setup dialog opens to the License Agreement. Read through the agreement. Use the Tab key to highlight
<OK>if it's not already highlighted, and press Enter to continue.Note
The mouse does not work while installing Packed Tracer using the CLI.
-
Use the Tab key to select
<Yes>and press Enter to accept the License Agreement.Note
It may take several minutes for the installation to finish.
-
Launch PacketTracer with the command
packettracerNote
There is a PacketTracer icon on the desktop that can also be used to launch the application.
Step 2: Log in to Packet Tracer🔗
-
The Cisco Packet Tracer Login window opens. Notice the toggle that allows you to Keep me logged in (for 3 months). If you would prefer not to log in each time Packet Tracer opens, click the toggle.
Note
If you receive a message asking if you'd like to run "multi-user" when Packet Tracer opens, slect No to continue
-
Click on the green Skills For All logo.
-
Log in with your Networking Academy credentials.
-
After successfully logging in, you will be returned to the main Packet Tracer window.
Part 2: Explore the Network Topology🔗
In this Part, you will become familiar with the topology you will use for network programmability activities.
Step 1: Open the lab 9.3 Packet Tracer Activity file🔗
-
In the Packet Tracer window and click File > Open.
-
In the Open File dialog box, click the
devascfolder on the left then navigate tolabs/devnet-src/webex-teamsand open the file9.3 Packet Tracer - Compare CLI and SDN Controller Network Management.pka.Important
The Packet Tracer activity file includes instructions which may be different than these instructions in places. Please ensure you use these instructions, rather than the ones found in the Packet Tracer activity file.
Note
If you receive the error
Cannot launch the Resource script module because it is disabled. Please enable it before trying againclick OK to continue. It may appear more than once.
Step 2: Review the network configuration documentation🔗
The network is configured as follows:
- Routers are running OSPFv2.
- SSH is enabled on all devices with user
ciscoand passwordcisco123! - R1 has no hosts attached, only a server.
- R2 LAN IPv4 is statically configured.
- R3 is the DHCPv4 server for LAN1 and LAN2.
- Switches are Layer 2 (no VLANs).
- All SWR# switches belong to LAN1.
Step 3: Verify that all devices can ping each other🔗
Use the command prompt on each PC to verify that all PCs can ping each other and the Example Server. You can access the command prompt by double-clicking on a PC, choosing the Desktop tab, and clicking Command Prompt.
Important
Do not proceed until the PCs have full connectivity (the first few pings may time out, but should succeed eventually).
Part 3: Use the CLI to Gather Information🔗
In this part, you manually access each device to gather information about the software version.
Step 1: From the Admin PC, securely access the SWR3 switch🔗
The Admin PC is the one in the top right corner of the topology, labeled Admin.
-
Click the Admin PC and go to Desktop > Command Prompt.
-
Enter the command
ssh -l cisco 10.0.1.4. The-loption is the lowercase letter "L", not the number one. -
When prompted, enter
cisco123!as the password. You are now logged in to SWR3.
Step 2: Gather information about the software on SWR3🔗
-
Enter the following command to filter the output of the
show versioncommand to view just theRELEASE SOFTWAREinstalled on the device. Notice that SWR3 is runningIOS 16.3.2andBoot Loader 4.2.6.SWR3# show version | include RELEASE Cisco IOS Software [Denali], Catalyst L3 Switch Software (CAT3K_CAA-UNIVERSALK9-M), Version 16.3.2, RELEASE SOFTWARE (fc4) BOOTLDR: CAT3K_CAA Boot Loader (CAT3K_CAA-HBOOT-M) Version 4.26, RELEASE SOFTWARE (P) SWR3#Note
The command is case-sensitive, so make sure you type RELEASE in all caps.
-
Copy the information to your clipboard.
-
Open the Pluma text file editor in the DEVASC VM (Ubuntu Menu > All > Pluma) and paste the information into a text file.
-
Save the file as
software-versions.txtin the~/labs/devnet-src/webex-teamsfolder.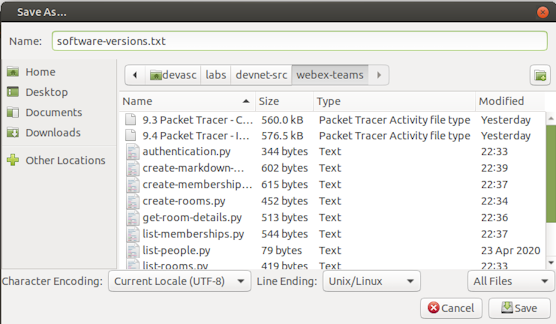
-
Exit out of the SSH session.
SWR3# exit

[Connection to 10.0.1.4 closed by foreign host]
C:\>
Part 4: Configure an SDN Controller🔗
For many years, network administrators have used early automation tools such as bash scripts or SNMP-enabled software to complete a process similar to what you did in the previous step for every device. However, with the introduction of SDN, this process has been greatly enhanced. Packet Tracer provides a simple PT-Controller to simulate an SDN controller. In this Part, you will connect and configure the PT-Controller.
Note
To learn more about Packet Tracer's implementation of the Network Controller, click the Help menu, then Contents. In the Index on the left, about midway down, you will find the heading Configuring Devices. Underneath this heading, find Network Controllers.
Step 1: Add a Network Controller to the topology🔗
-
At the bottom left corner of the Packet Tracer interface, click End Devices > Network Controller.
Note
End Devices uses an icon that has a phone, PC, and server.
-
Add the Network Controller in the blank spot left of the SWL1 switch, above the Example Server. The name should already be
PT-Controller0. If not, click the name and change it. -
At the bottom again, click the lightning bolt icon for Connections. Click the solid black Copper Straight-Through cable.
-
Click PT-Controller0 and choose GigabitEthernet0. Then click SWL1 and choose the first available GigabitEthernet interface.
Part 2: Configure connectivity for the PT-Controller0🔗
-
Click PT-Controller0 > Config.
-
For Gateway/DNS IPv4, enter
192.168.101.1as the Default Gateway address. -
On the left under INTERFACE, click GigabitEthernet0.
Note
If you receive a Default Gateway Warning, just press OK to continue.
-
For IP Configuration, enter the IPv4 Address
192.168.101.254and Subnet Mask255.255.255.0. -
On the left, under REAL WORLD, click Controller. If the Server Status is
Stopped, skip the following substeps. If the Server Status is Disabled in Preferences, then you will need to enable external access by following these instructions:- Select Options > Preferences from the Packet Tracer menus.
- Click Miscellaneous.
- Under External Network Access, click Enable External Access for Network Controller REST API.
- Close Preferences and click PT-Controller0 > Config, if necessary.
- On the left under REAL WORLD, click Controller.
-
The Server Status should now be
Stopped. Click Access Enabled to enable it. Server Status changes to Listening on port 58000. If the port is some other value, change it to58000. This is the port number in the Python scripts. -
Close the PT-Controlloer0 window.
Step 3: From Admin, verify connectivity to the PT-Controller0🔗
-
On Admin PC open the Command Prompt again and verify you can ping PT-Controller0 (
192.168.101.254). If you are not able to ping, make sure your configuration matches the specifications in the previous step.Note
The first couple of pings may time out. This is normal as long as they eventually start working
Step 4: Register a new user and log into the PT-Controller0🔗
-
Still on the Admin PC, click the X at the end of the blue Command Prompt bar. Click on Web Browser. It's the last icon in the top row so you may need to scroll the window over or make it wider to see it.
-
In the URL field, enter the IPv4 address
192.168.101.254and click Go to access the User Setup for PT-Controller0. -
Enter
ciscoin the Username field andcisco123!in the Password and Confirm Password fields, and then click SETUP. -
On User Login screen, enter the credentials you just created and click LOG IN.
-
You are now logged in to the dashboard for PT-Controller0. At this point, it may be helpful to expand the window to fill the screen so you can see the entire interface.
Part 5: Use an SDN Controller to Discover a Topology🔗
In this Part, you will configure PT-Controller0 to use Cisco Discover Protocol (CDP) to automatically discover the nine network devices in your topology. The PT-Controller0 will also discover all five host devices attached to the network.
Step 1: Add credentials to access all the network devices in the topology🔗
-
From the Network Controller GUI, click the menu button to the left of the Cisco logo.
-
Select Provisioning. From here, you can manually add networking devices. However, you will use CDP to automatically discover devices for you.
-
Click CREDENTIALS and then click + CREDENTIAL to add a New Credential.
-
For Username, enter
cisco, and for Password, entercisco123!. Leave Enable Password blank. For Description, enteradmin credentials, and then click OKAY. -
The new CLI Credentials are now stored on PT-Controller0 for use in automation tasks.
Step 2: Use CDP to discover all the devices on the network🔗
-
Click DISCOVERY and the click + DISCOVERY to add a New Discovery.
-
For Name, enter
SWL1. For IP Address, enter192.168.101.2. For CLI Credential List, drop down the list and choosecisco - admin credentials. -
Click ADD.
-
You should now see the Status as In Progress. You can wait for Packet Tracer to finish simulating this process. Or you can click the Fast Forward Time button a few times on the main Topology window to speed up the process.
Important
Do not proceed until a green checkmark appears next to all tasks, which may take a few minutes.
Part 6: Use an SDN Controller to Gather Information🔗
In this Part, you will use the PT-Controller0 GUI to view information about the network devices and host devices in the topology. You will view the topology created by the controller and then conduct a path trace across the network.
Step 1: View the list of network devices discovered🔗
-
Click NETWORK DEVICE. You should now see all nine network devices listed.
-
Click the Gear icon
 next to any device's hostname to see the information collected by the discover process. Notice that the Software Version is listed as well as a variety of other detailed information about the device.
Step 2: View a list of all the host devices discovered🔗
-
Return to the Dashboard. Click the menu next to the Cisco logo, then click Dashboard. (You can also simply click the Network Controller banner to return to the Dashboard from anywhere.)
-
On the Dashboard, you will see charts with the number of hosts that can be reached via ping and the number of network devices that are managed. Both should be
100%. -
You should also see tiles for QoS, Network Device, and Host. Click the Gear icon
for Host. This will take you to the HOSTS tab for ASSURANCE. -
On this page, you can view all the Layer 2 and Layer 3 connectivity information for each host as well as the network device to which each is attached.
-
Click the Gear icon
next to any host to view more detailed information.
Step 3: View the topology created by PT-Controller0🔗
-
Click the TOPOLOGY tab. Notice that the PT-Controller dynamically created the same topology you see in Packet Tracer's main window.
-
From this view, you can click any network device, or any link between devices, to see its details.
-
You can also click and drag the device icons to rearrange the topology. However, your changes will not be saved when you leave the TOPOLOGY workspace.
Step 4: Trace the path from one device to another device🔗
-
Click the PATH TRACE tab.
-
Click + PATH to add a New Path.
-
Trace the path from one end of the network to the other. Enter the IP address of PC1 in the source field (
10.0.1.130) and the IP address of PC4 (192.168.102.3) in the destination field. Then click OKAY. -
Click the new path that was added to initiate the path trace.
You will get a Route report that shows all the hops from source to destination. Notice that only Layer 3 device information is listed. The switches are shown as an UNKNOWN device. This is because they are all operating at Layer 2 only.
Part 7: Use an SDN Controller to Configure Network Settings🔗
A major benefit of network automation using a controller is the ability to configure global network settings and policies for all devices and then push that configuration with the click of a button. In this Part, you will configure PT-Controller0 with network settings for DNS, NTP, and Syslog. You will then push this configuration to supported network devices. Finally, you will verify and test the policy.
Step 1: Investigate the configuration of the Example server🔗
-
Return to the Packet Tracer topology window.
-
Click Example Server > Services.
-
Under SERVICES, click DNS. Notice that the DNS service is enabled and that there is one record for
www.example.com. -
Under SERVICES, click SYSLOG. Notice that the Syslog service is enabled (
on). -
Under SERVICES, click NTP. Notice that the NTP service is enabled (
on). -
Use the calendar to set the date to the current date.
-
Use the box with the time to set the current time.
-
Close the Example Server window.
Step 2: Configure a global policy for DNS, SYSLOG, and NTP🔗
-
Click the Admin PC. If you closed Admin, you will need to open the Web Browser app and reauthenticate with PT-Controller0 (
192.168.101.254). -
Click the menu to the left of the Cisco logo.
-
Click Policy.
-
On the QOS tab, notice there are options for configuring the Scope and Policy. In this activity, you will configure NETWORK SETTINGS.
-
Click NETWORK SETTINGS.
-
Click DNS. Enter
example.comas the Domain Name and192.168.101.100as the IP Address. -
Click Save.
-
Click NTP.
-
Enter
192.168.101.100as the IP Address. -
Click Save.
-
Click SYSLOG.
-
Enter
192.168.101.100as the IP Address. -
Click Save.
-
Click DNS, NTP, and SYSLOG again to verify the information is correct. If not, correct the information saving each time.
-
Click PUSH CONFIG.
-
The Push All Network Settings dialog box opens. Verify your settings and click OKAY. A
Saved Successfullymessage appears briefly.
Step 3: Verify and test the network settings that were pushed to devices🔗
At the bottom of the NETWORK SETTINGS window, there is the following message:
Note: This functionality is only supported on devices running IOS-XE OS and Switch 2960-24TT
This means that, for this version of Packet Tracer, your global settings were only applied to the routers.
-
Return the to Topology window and click any of the three routers. R1 is shown in the output below.
-
Click CLI.
-
Click inside the window and press Enter to get a command prompt.
-
Enter the privileged EXEC mode and verify the DNS settings.
R1> enable R1# show run | begin ip domain ip domain-name example.com ip name-server 192.168.101.100 ! <output omitted> R1# -
Enter the following commands to verify the NTP settings. The time on R1 should match your current time. Packet Tracer may take a little time to propagate NTP messages. You can click the Fast Forward Time button on the Topology page a few times to speed up the process.
R1# show ntp associations address ref clock st when poll reach delay offset disp *~192.168.101.100127.127.1.1 1 12 16 377 0.00 0.00 0.12 * sys.peer, # selected, + candidate, - outlyer, x falseticker, ~ configured R1# show clock 14:52:20.288 UTC Fri Mar 28 2026 R1# -
Enter the following command to verify logging is configured.
R1# show run | include logging logging 192.168.101.100 R1# -
To test logging, shut down the
Serial0/1/0interface and then reactivate it.R1# configure terminal Enter configuration commands, one per line. End with CNTL/Z. R1(config)# interface s0/1/0 R1(config-if)# shutdown %LINK-5-CHANGED: Interface Serial0/1/0, changed state to administratively down %LINEPROTO-5-UPDOWN: Line protocol on Interface Serial0/1/0, changed state to down 15:36:37: %OSPF-5-ADJCHG: Process 1, Nbr 192.168.2.1 on Serial0/1/0 from FULL to DOWN, Neighbor Down: Interface down or detached R1(config-if)# no shutdown %LINK-5-CHANGED: Interface Serial0/1/0, changed state to up %LINEPROTO-5-UPDOWN: Line protocol on Interface Serial0/1/0, changed state to up 15:36:53: %OSPF-5-ADJCHG: Process 1, Nbr 192.168.2.1 on Serial0/1/0 from LOADING to FULL, Loading Done R1(config-if)# end R1# -
Click Example Server > Services > SYSLOG. You should see the same syslog messages you saw on in the CLI are also logged to the server. Double-click any of the entries to review the messages.
-
Save the Packet Tracer activity file: File > Save.
9.4 Implement REST APIs with an SDN Controller (PacketTracer Lab)🔗
Objectives🔗
Part 1: Verify External Connectivity to Packet Tracer
Part 2: Request an Authentication Token with Postman
Part 3: Send REST Requests with Postman
Part 4: Send REST Requests with VS Code
Background🔗
In this Packet Tracer activity, you will use the Packet Tracer Network Controller and associated API documentation to send REST requests from Postman and from Visual Studio Code (VS Code). Packet Tracer also supports a Python coding environment. Therefore, in the final Part of this activity, you will send REST requests from within Packet Tracer.
Instructions🔗
Part 1: Verify External Connectivity to Packet Tracer🔗
In this Part, you will verify that Packet Tracer can be accessed by other applications on the DEVASC VM. This activity must be completed entirely within the DEVASC virtual machine environment. Support for other setups is not provided.
Step 1: Open the Packet Tracer activity🔗
-
Return to the open Packet Tracer window and click File > Open.
-
If prompted to save changes from the previous lab, choose Yes to be safe.
-
In the Open File dialog box navigate to
~/labs/devnet-src/webex-teamsand open the file9.4 Packet Tracer - Implement REST APIs with an SDN Controller.pka.Important
The Packet Tracer activity file includes instructions which may be different than these instructions in places. Please ensure you use these instructions, rather than the ones found in the Packet Tracer activity file.
Note
If you receive the error
Cannot launch the Resource script module because it is disabled. Please enable it before trying againclick OK to continue. It may appear more than once.
Step 2: Verify Packet Tracer's settings for external access🔗
-
Click Options > Preferences > Miscellaneous. Under External Network Access, verify that Enable External Access for Network Controller REST API is checked.
-
Close the Preferences window.
-
Click PT-Controller0 > Config.
-
On the left, under REAL WORLD, click Controller.
-
Click on the Access Enabled checkbox to start the server and make note of the port number, which is most likely
58000. This is the port number you will need when externally accessing the Packet Tracer activity from Chromium, VS Code, and Postman later in this activity. -
Close the PT-Controller0 window.
Step 3: Verify you can access Packet Tracer from another program on the DEVASC VM🔗
-
On the DEVASC VM desktop, open Chromium and navigate to
http://localhost:58000/api/v1/host.Important
Make sure you leave Packet Tracer open and running the lab.
You will get the following response. This step verifies that you can externally access Packet Tracer and PT-Controller0. Notice that authorization requires a ticket. You will get an authorization token in the next Part.
{
    "response": {
        "detail": "Security Authentication Failure",
        "errorCode": "REST_API_EXTERNAL_ACCESS",
        "message": "Ticket-based authorization: empty ticket."
    },
    "version": "1.0"
} {
Part 2: Request an Authentication Token with Postman🔗
In this Part, you will investigate the REST API documentation in Packet Tracer and use Postman to request an authentication token from the PT-Controller0. You can also do this in VS Code with a Python script.
Step 1: Investigate the REST API documentation for the Network Controller🔗
To see the REST API documentation for PT-Controller0, complete the following steps:
-
Return to the Packet Tracer topology window and click the Admin PC then click Desktop > Web Browser.
-
Enter
192.168.101.254in the URL field and click Go. -
Log in to PT-Controller0 with user
ciscoand passwordcisco123!. -
Click the menu next to the Cisco logo and choose API Docs.
-
In the API documentation, click addTicket from the menu on the left. You will use this documentation in the next step.
Step 2: Create a new POST request🔗
-
After reviewing the addTicket REST API Method documentation, open Postman . In the Launch area, click the plus sign to create a new Untitled Request.
-
Click the down arrow and change the type from GET to POST.
-
Enter the URL
http://localhost:58000/api/v1/ticket. -
Below the URL field, click Body. Change the type to raw.
-
Click the down arrow next to Text and change it to JSON. This change will also set the "Content-type" HTTP Header to "application/json" that is required for this API call.
-
Paste the following JSON object into the Body field. Make sure your code is properly formatted.
{
    "username": "cisco",
    "password": "cisco123!"
}
Step 3: Send the POST request🔗
-
Click Send to send the POST request to the PT-Controller0. You should get a response similar to the following. However,
your_serviceTicketwill be an actual value.{ "response": { "idleTimeout": 900, "serviceTicket": "your_serviceTicket", "sessionTimeout": 3600 }, "version": "1.0" } -
Copy the
serviceTicketvalue without the quotes to a text file for later use.
Part 3: Send REST Requests with Postman🔗
In this Part, you will use your service ticket to send three REST requests to the PT-Controller0.
Step 1: Create a new GET request for all network devices in the network🔗
-
In Postman , click the plus sign to create a new Untitled Request.
-
Enter the URL
http://localhost:58000/api/v1/network-device. -
Below the URL field, click Headers.
-
Under the last KEY, click the Key field and enter
X-Auth-Token. -
In the Value field, enter the value for your service ticket that you copied earlier.
Step 2: Send the GET request🔗
-
Click Send to send the GET request to the PT-Controller0. You should get a response listing the details that the controller has for the nine network devices in the network. The response for the first device is shown here.
{
    "response": [
        {
            "collectionStatus": "Managed",
            "connectedInterfaceName": [
                "GigabitEthernet0/0/0",
                "GigabitEthernet0",
                "FastEthernet0"
            ],
            "connectedNetworkDeviceIpAddress": [
                "192.168.101.1",
                "192.168.101.254",
                "192.168.101.100"
            ],
            "connectedNetworkDeviceName": [
                "R1",
                "NetworkController",
                "Example Server"
            ],
            "errorDescription": "",
            "globalCredentialId": "53046ecc-88c3-49f6-9626-ca8ab9db6725",
            "hostname": "SWL1",
            "id": "CAT1010BT47-uuid",
            "interfaceCount": "29",
            "inventoryStatusDetail": "Managed",
            "lastUpdateTime": "6",
            "lastUpdated": "2020-06-11 22:55:51",
            "macAddress": "000C.CF42.2B11",
            "managementIpAddress": "192.168.101.2",
            "platformId": "3650",
            "productId": "3650-24PS",
            "reachabilityFailureReason": "",
            "reachabilityStatus": "Reachable",
            "serialNumber": "CAT1010BT47-",
            "softwareVersion": "16.3.2",
            "type": "MultiLayerSwitch",
            "upTime": "4 hours, 55 minutes, 11 seconds"
        },
<output omitted>
    ],
    "version": "1.0"
}
Step 3: Duplicate the GET request and modify it for all hosts on the network🔗
-
In Postman, right-click the tab for your host GET request and choose Duplicate Tab.
-
All information in the ticket is the same except for the URL. Simply change
network-devicetohost:http://localhost:58000/api/v1/host.
Step 4: Send the GET request🔗
-
Click Send to send the GET request to the PT-Controller0. You should get a response listing the details that the controller has for the six host devices in the network. The response for the first device is shown here.
{
    "response": [
        {
            "connectedAPMacAddress": "",
            "connectedAPName": "",
            "connectedInterfaceName": "GigabitEthernet1/0/24",
            "connectedNetworkDeviceIpAddress": "192.168.102.2",
            "connectedNetworkDeviceName": "SWL2",
            "hostIp": "192.168.102.3",
            "hostMac": "00E0.F96C.155B",
            "hostName": "PC4",
            "hostType": "Pc",
            "id": "PTT08108MO8-uuid",
            "lastUpdated": "2020-06-11 22:49:32",
            "pingStatus": "SUCCESS"
        },
<output omitted>
    ],
    "version": "1.0"
}
Step 5: Close Postman🔗
- Close Postman to free up memory in the DEVASC VM
Part 4: Send REST Requests with VS Code🔗
In this Part, you will use a Python script in VS Code to send the same API requests you sent in Postman. However, you will also use Python for loops to parse the JSON and display only specific key value pairs.
Step 1: Use a script to request a service ticket🔗
-
Open VS code .
-
Click File > Open Folder... and navigate to the
~/labs/devnet-src/ptnadirectory. -
Click Open.
Notice in the EXPLORE pane on the left that three scripts are shown:
01_get-ticket.py,02_get-network-device.py, and03_get-host.py. Review the code for each. Notice that the scripts for network devices and hosts require that you replace theyour_serviceTicketvalue with the value Packet Tracer gave you when you requested a ticket. Request a new service ticket to see the function of the01_get-ticket.pyscript. -
Open a terminal window in VS Code: Terminal > New Terminal.
-
In the VS Code terminal, run the
01_get-ticket.pyto see output similar to the following, except thatyour_serviceTicketwill be an actual value.devasc@labvm:~/labs/devnet-src/ptna$ python3 01_get-ticket.py Ticket request status: 201 The service ticket number is: your_serviceTicket devasc@labvm:~/labs/devnet-src/ptna$ -
Replace the
your_serviceTicketvalue in02_get-network-device.pyand03_get-host.pywith the value Packet Tracer gave you in this step. Do this now for both files.
Step 2: Use a script to request a list of network devices🔗
Previously in Postman, the call to the network device's API returned a list of all nine network devices and all the information available for each device. However, the 02_get-network-device.py script prints only the values of the keys that the programmer is interested in: hostname, platformId, and managementIpAddress.
-
In the terminal window, run the
02_get-network-device.pyscript.devasc@labvm:~/labs/devnet-src/ptna$ python3 02_get-network-device.py Request status: 200 SWL1 3650 192.168.101.2 R1 ISR4300 192.168.1.2 R3 ISR4300 192.168.2.1 SWR1 3650 10.0.1.2 SWR2 3650 10.0.1.3 R2 ISR4300 192.168.2.2 SWL2 3650 192.168.102.2 SWR4 3650 10.0.1.5 SWR3 3650 10.0.1.4 devasc@labvm:~/labs/devnet-src/ptna$
Step 3: Use a script to request a list of host devices🔗
Similarly, the programmer chose to list specific information for each of the six host devices connected to the network.
-
In the terminal window, run the
03_get-host.pyscript.devasc@labvm:~/labs/devnet-src/ptna$ python3 03_get-host.py Request status: 200 PC4 192.168.102.3 00E0.F96C.155B GigabitEthernet1/0/24 PC3 10.0.2.129 0004.9A42.C245 GigabitEthernet1/0/24 PC1 10.0.1.129 00E0.A330.3359 GigabitEthernet1/0/22 PC2 10.0.2.130 0060.47C1.A4DB GigabitEthernet1/0/23 Admin 10.0.1.130 0050.0FCE.B095 GigabitEthernet1/0/21 Example Server 192.168.101.100 000A.413D.D793 GigabitEthernet1/0/3 devasc@labvm:~/labs/devnet-src/ptna$ -
Close VS Code and the Packet Tracer file, and choose Yes when prompted to save.
Step 3: Commit the changes to the repository🔗
-
Open a terminal window and navigate to
~/labs/devnet-src/webex-teams.Note
If a terminal window is already open with
Starting Packet Tracer 8.2.2in it, you can press Ctrl+C to stop Packet Tracer and reuse the terminal window for these steps. Be sure to change to the~/labs/devnet-src/webex-teamsdirectory before continuing. -
Add all the remaining files to the staging area using
git add .(don't miss the "." at the end).devasc@labvm:~/labs/devnet-src/webex-teams$ git add . -
Use
git statusto verify that the 3 files have been staged for commit.devasc@labvm:~/labs/devnet-src/webex-teams$ git status On branch main Changes to be committed: (use "git restore --staged <file>..." to unstage) modified: 9.3 Packet Tracer - Compare CLI and SDN Controller Network Management.pka modified: 9.4 Packet Tracer - Implement REST APIs with an SDN Controller.pka new file: software-versions.txt devasc@labvm:~/labs/devnet-src/webex-teams$ -
Commit the changes to the local repository using the message Lab Complete!.
devasc@labvm:~/labs/devnet-src/webex-teams$ git commit -m "Lab Complete!"
[main ad4f76d] Lab Complete!
 3 files changed, 2 insertions(+)
 create mode 100644 software-versions.txt
devasc@labvm:~/labs/devnet-src/webex-teams$
Step 4: Push all changes to the remote repository on GitHub🔗
-
Push all the changes you made in the local repository back to the GitHub repository to complete the lab. Remember to use your Personal Access Token when asked for your GitHub password.
Tip
If you’ve configured your VM to use SSH to connect to GitHub instead of HTTPS, you will not be asked for a username and password, although you may be asked for a passphrase for your SSH key, if you configured one.
devasc@labvm:~/labs/devnet-src/webex-teams$ git push origin main Username for 'https://github.com': <username> Password for 'https://<username>@github.com': Personal Access Token Enumerating objects: 24, done. Counting objects: 100% (24/24), done. Delta compression using up to 2 threads Compressing objects: 100% (14/14), done. Writing objects: 100% (14/14), 1.19 MiB | 30.39 MiB/s, done. Total 14 (delta 8), reused 0 (delta 0), pack-reused 0 (from 0) remote: Resolving deltas: 100% (8/8), completed with 1 local object. To github.com:Ontario-Tech-NITS/lab-9-cisco-platforms-and-apis-josh-test-student.git b80f6e7..ad4f76d main -> main devasc@labvm:~/labs/devnet-src/webex-teams$ -
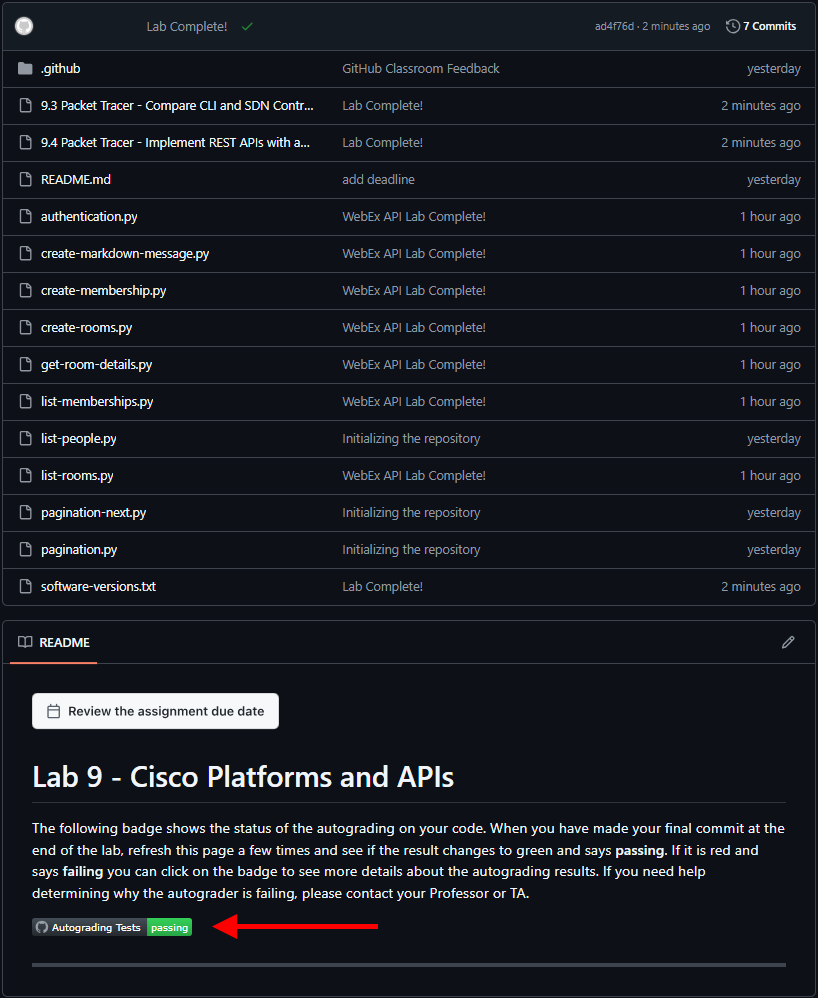
In your browser, return to the repository on github.com and verify all your changes are present, along with the corresponding commit messages. Wait a minute or so for the autograder tests to complete and ensure that it says passing in green.